Practical SQL Query Tuning: Better Performance Without Rewriting Architecture
Table of Contents
- Start from Symptoms: When Should You Tune Queries?
- Step 1: Find the Most Expensive Queries with Slow Logs
- Step 2: Reading Execution Plans Without Panicking
- Step 3: Choosing and Designing the Right Indexes
- Common Query Anti-Patterns You’ll See Everywhere
- Case Study: Before and After Tuning
- When Tuning Isn’t Enough and You Need Other Solutions
Start from Symptoms: When Should You Tune Queries?
Before rushing to add indexes or swap out your ORM, you need to confirm the bottleneck is actually in the queries, not somewhere else (slow app startup, network issues, overloaded downstream services).
Typical signs of query problems:
- Certain endpoints suddenly slow down under load even though the application logic seems simple.
- Database CPU usage spikes even when request volume isn’t that high.
- Users report “page X often times out,” and when you trace it, the request always stalls on database reads/writes.
More subtle hints:
- Queries that used to be fast start slowing down as data volume grows.
- Reports or batch jobs that once finished in minutes now take half an hour or more.
Instead of guessing, you need:
- Observability data: logs, metrics, traces.
- A systematic way to find which queries are causing the most pain.
That’s what the next steps cover: start from slow logs, move to execution plans, and only then talk about index design and query patterns.
Step 1: Find the Most Expensive Queries with Slow Logs
Rather than tuning every query, focus on the small set of queries that are most expensive. Pareto usually applies: 20% of queries cause 80% of performance problems.
Practical steps:
- Enable slow query logs (available in MySQL, PostgreSQL, etc.).
Set a reasonable threshold, for example:- 500 ms for synchronous APIs.
- More relaxed for batch jobs.
- Collect and aggregate:
- Group queries by template (not by literal values).
- Count how many times each appears and its average duration.
- Prioritize by impact:
- Look for a combination of high frequency + high duration.
- Don’t get stuck chasing super-rare outliers while ignoring everyday pain.
If you have APM/observability (New Relic, Datadog, OpenTelemetry, etc.), use:
- Built-in “slow query” dashboards.
- End-to-end traces to see time spent in DB vs application.
The outcome should be a short list (say 5–10 queries) worth deeper analysis, each with:
- Example query,
- Tables involved,
- Average and p95/p99 durations,
- The endpoints or jobs that use it.
Step 2: Reading Execution Plans Without Panicking
Execution plans (EXPLAIN) can look scary, but a few key elements almost always matter:
- Scan type:
Seq Scan/ table scan: reading the whole table.Index Scan/Index Seek: using indexes effectively.Index Only Scan: even more efficient, reading only from indexes.
- Estimated vs actual rows (when using
EXPLAIN ANALYZE):- If estimates are way off, your statistics are stale → the planner picks poor plans.
- Most expensive nodes:
- Check
costand actual timing on each node. - Find the node taking the largest share of total execution time.
- Check
Common issues:
- Filters and joins running without indexes on the columns used in
WHERE/JOIN. - Functions applied to indexed columns (
LOWER(column),DATE(column)) so indexes can’t be used directly. - Large sorts (
ORDER BY) without supporting indexes → expensive in-memory or disk sorts.
A simple strategy for reading plans:
- Run the query with
EXPLAIN ANALYZE. - Highlight the most expensive node (by time and rows).
- Ask: “How can I reduce the number of rows flowing through this node?”
The answer is usually a better index or improved filter/join conditions.
Step 3: Choosing and Designing the Right Indexes
Indexes can be lifesavers—but also dead weight if there are too many or they’re poorly designed. What matters isn’t “more indexes,” but the right indexes for real-world query patterns.
Core principles:
- Indexes follow queries, not the other way around: always design indexes based on actual
WHERE,JOIN, andORDER BYpatterns. - Column order in composite indexes matters:
- Put the most selective columns first (the ones that filter out the most rows).
- Match your filter patterns:
WHERE status = ? AND created_at BETWEEN ? AND ?→ an index on(status, created_at)often makes sense.
- Use partial/filtered indexes (if your DB supports them):
- For example, index only rows with
status = 'ACTIVE'if that’s the common case.
- For example, index only rows with
Simple PostgreSQL example:
CREATE INDEX idx_orders_status_created_at
  ON orders (status, created_at DESC);
Practical tips:
- Don’t rush to create a new index for every query; first check if existing indexes can be adjusted.
- Be aware of overhead:
- Each additional index slows
INSERT/UPDATE/DELETE. - Too many overlapping indexes can confuse the planner.
- Each additional index slows
Ideally you schedule regular index reviews to:
- Drop unused indexes (look at
idx_scan/usage stats). - Simplify or merge redundant indexes.
Common Query Anti-Patterns You’ll See Everywhere
These query patterns almost always cause trouble as your data grows:
-
SELECT *on large tables without clear filters- Pulls too many columns and rows.
- Harder to optimize because the DB doesn’t know which columns really matter.
-
Filtering in the application instead of in the DB
- Queries fetch large datasets, then code loops over them to filter.
- Push those conditions into
WHEREorJOINclauses.
-
Leading wildcards in patterns (
LIKE '%abc')- Almost always force full scans because indexes can’t be used effectively.
- Consider alternatives (reverse index, search engine, or revisiting requirements).
-
Over-joining without clear need
- Queries join many tables just to fetch one or two columns.
- Sometimes it’s better to split into two simpler queries that are easier to cache.
-
N+1 queries
- e.g. fetch a list of orders, then for each order run another query for its items.
- Fix with proper joins, batching (IN clauses), or carefully configured ORM eager loading.
Turning these into a code review checklist will prevent many performance issues from entering production in the first place.
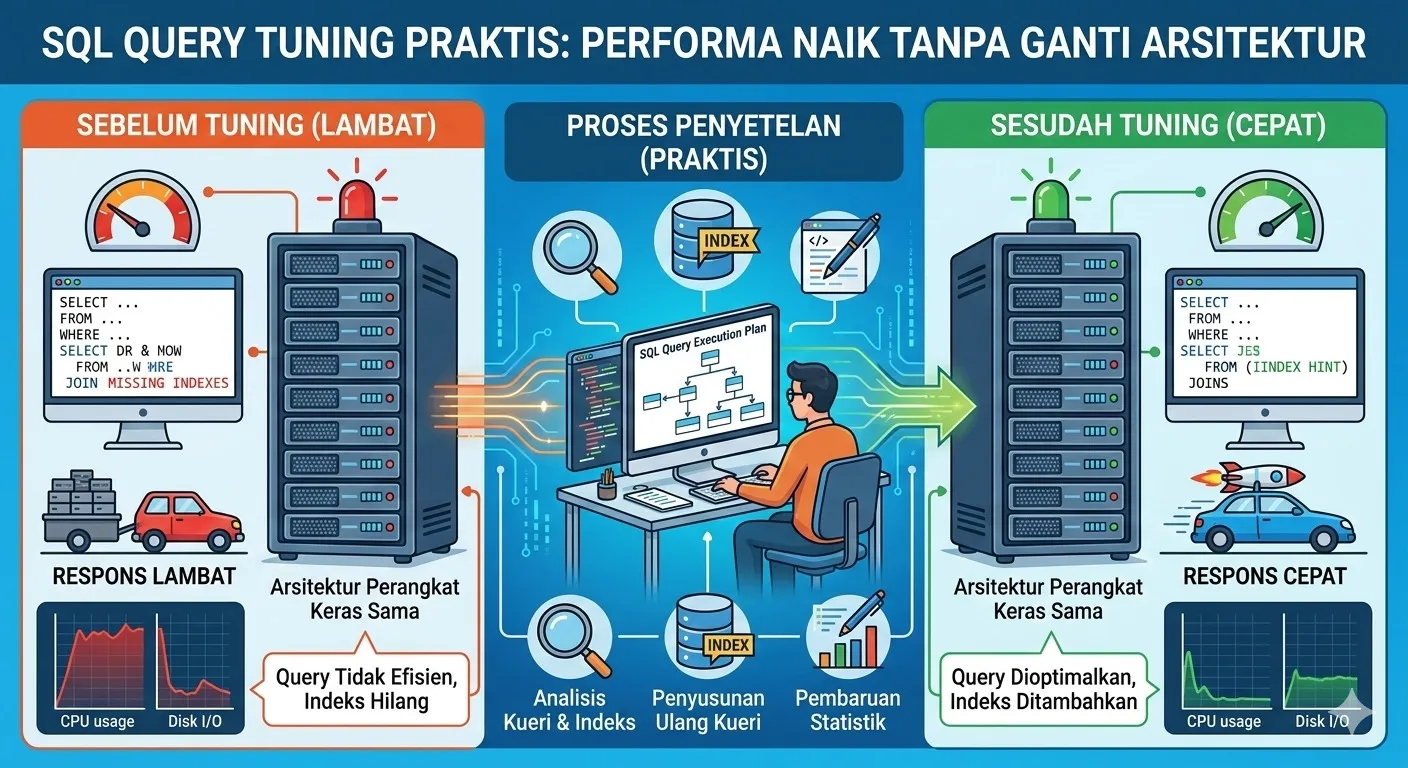
Case Study: Before and After Tuning
Imagine a slow endpoint: “List a customer’s recent orders with status filters” once data reaches hundreds of thousands of rows.
Original query:
SELECT *
FROM orders
WHERE customer_id = $1
  AND status IN ('PAID', 'SHIPPED')
ORDER BY created_at DESC
LIMIT 20;
Symptoms:
- Execution time creeps up to 1–2 seconds for very active customers.
- The execution plan shows a
Seq Scanonorders.
Tuning steps:
- Add a composite index:
CREATE INDEX idx_orders_customer_status_created_at ON orders (customer_id, status, created_at DESC); - Review selected columns:
- If the UI only needs a few fields (e.g.
id, total_amount, created_at, status), change the query to select just those.
- If the UI only needs a few fields (e.g.
- Ensure statistics are up to date:
- Run
ANALYZEor make sure autovacuum/statistics are healthy.
- Run
Result:
- The plan switches to an
Index Scanover far fewer rows. - Execution time drops dramatically (e.g. from 1.5 seconds to under 100 ms).
Note: no big architectural changes—just:
- The right index,
- A more selective query,
- Healthy statistics.
When Tuning Isn’t Enough and You Need Other Solutions
Not every performance problem can be solved with query and index tuning alone. Signs you need bigger changes:
- Even after reasonable tuning, DB resources stay maxed out and request queues remain long.
- Access patterns shift: new reports now scan almost entire tables regularly.
- Read/write load grows much faster than a single database instance can handle.
Options beyond tuning:
- Sharding or partitioning:
- Split data by key (tenant, date, etc.).
- Reduce the amount of data scanned per query.
- Read replicas:
- Move heavy read traffic to replicas.
- Ideal for reports, dashboards, or mostly-read endpoints.
- Application-level caching:
- Cache results of heavy queries that are often repeated with the same parameters.
- Use Redis, in-memory caches, or HTTP caching where appropriate.
- Separate search/analytics engines:
- For complex text search or heavy analytics, consider Elasticsearch, OpenSearch, ClickHouse, etc.
The key: start with the cheap wins (queries and indexes) before jumping to large-scale solutions—but don’t expect a single monolithic database to handle all workloads forever without help.
References
- Use the Index, Luke — Markus Winand
- PostgreSQL EXPLAIN Documentation
- MySQL Performance Blog — Percona
- High Performance MySQL — Baron Schwartz et al.
Related Articles
- Database Design Fundamentals
- Building a Type-Safe API with TypeScript from Scratch
- Observability 101: Logs, Metrics, and Traces for Modern Teams
Ever discovered a query that looked innocent but secretly tortured your database server? Or have a tuning trick that delivered huge performance gains? Share your stories in the comments—real-world cases are the best learning material! 💬